Urban Green Space Planning Scale Model
Introduction
Parks are not just nice to have.
They cool cities, absorb stormwater, and improve mental health.
But how do you plan a network of green spaces that serves all residents?
Digital maps show locations.
They miss the experience.
You need a physical model.
Specifically, an Urban Green Space Planning Scale Model.
This guide explains why green space models matter.
What features to include.
And how to use them for climate adaptation and public engagement.
Let us begin.
What Is an Urban Green Space Planning Scale Model?
It is a physical miniature of a city’s park system and natural areas.
Built on a sand‑textured base.
An Urban Green Space Planning Scale Model shows parks, greenways, urban forests, community gardens, green roofs, and blue infrastructure (ponds, wetlands).
Unlike a land‑use model, this one emphasizes vegetation, water, and connectivity.
Green corridors link habitats.
Tree canopies are represented.
The model is used by parks departments, climate adaptation planners, and public health officials.
Why Green Space Planning Needs a Physical Model
Green spaces are about human experience.
A digital map cannot convey how a tree‑lined boulevard feels.
An Urban Green Space Planning Scale Model helps residents and officials see the green network.
They understand where a new park will serve a dense neighborhood.
They see how greenways connect to schools and transit.
Also, the model supports climate resilience planning.
Planners identify heat island hotspots and locate cooling green spaces.
Stormwater managers align wetlands with drainage needs.
For funding applications, a beautiful green model demonstrates community benefit.
Key Features of an Urban Green Space Planning Scale Model
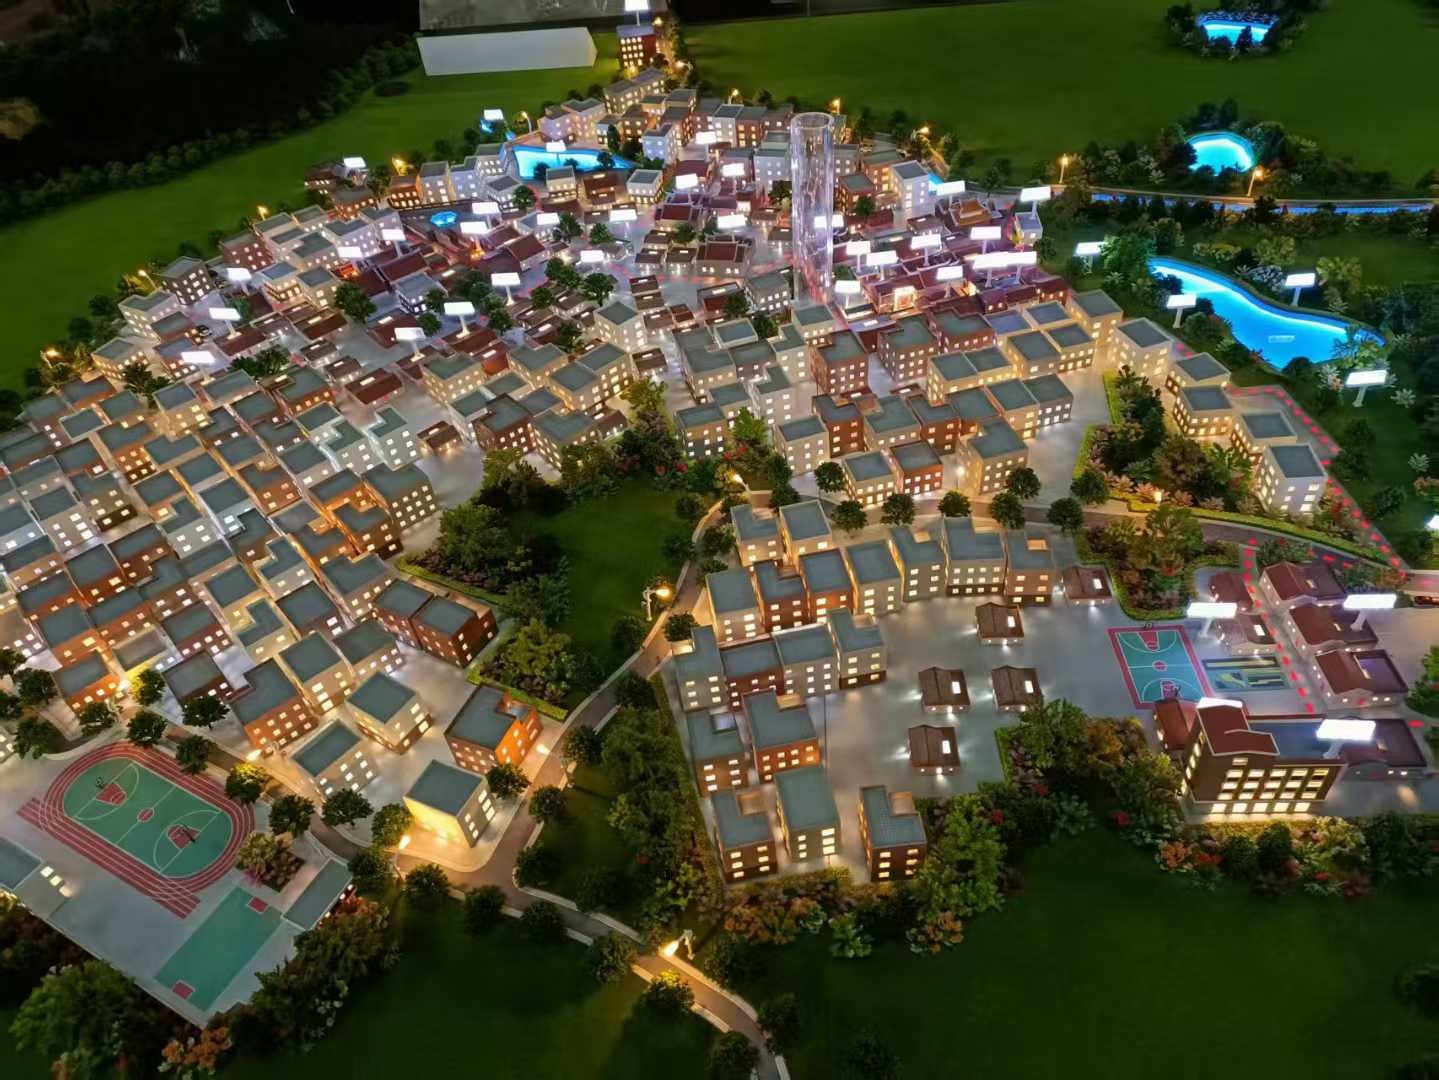
Let us break down what makes a model effective for green space planning.
Park Hierarchy
Regional parks (large), community parks (medium), pocket parks (small), linear parks (greenways).
Different shades of green or distinct symbols.
Green Corridors and Connectivity
Wildlife corridors, pedestrian greenways, bike trails, riparian buffers.
Shown as green ribbons connecting larger parks.
Urban Forest and Tree Canopy
Tree coverage indicated by textured green areas or small tree symbols.
Street trees along major roads.
Blue Infrastructure
Wetlands, detention ponds, rain gardens, bioswales, streams.
Blue resin or textured blue overlays.
Green Building Features
Green roofs, vertical gardens, rain barrels.
Shown on building massing blocks.
Heat Vulnerability and Cooling Zones
Areas with high heat island risk overlaid with warm colors.
Proposed cooling green spaces in cool colors.
Equity and Access
Walking distance buffers (5‑minute, 10‑minute) around parks.
Areas lacking access highlighted.
Public Engagement Features
Removable green space overlays for “what‑if” scenarios.
Stickers for residents to suggest new park locations.
A well‑designed Urban Green Space Planning Scale Model answers: “Is nature within a short walk of every resident?”
Materials for Green Space Models
Green space models emphasize vegetation and water.
Laser‑cut MDF or acrylic – For building massing blocks (minimal).
Colored flocking (various greens) – For parks, greenways, and tree canopy.
Blue resin – For ponds, wetlands, and streams.
Fine sand or earth‑toned paint – For ground.
Transparent overlays – For heat vulnerability and access buffers.
Small tree models – For street trees and urban forest accents.
Printed vinyl – For labels and park names.
Avoid dense building detail – the green spaces should dominate visually.
The Custom Production Process: Step by Step
How is an urban green space planning scale model made?
Here is the typical workflow.
Step 1: Green Infrastructure Data
You provide park inventories, tree canopy maps, heat island assessments, and stormwater plans.
The model maker identifies existing and proposed green features.
Step 2: Scale Selection
Common scales: 1:2,000 to 1:10,000.
1:2,000 for a detailed neighborhood green network.
1:5,000 for a district or small city.
Step 3: Base and Terrain
A reinforced MDF base is cut.
Topography sculpted for drainage and view corridors.
Step 4: Gray Infrastructure (Minimal)
Building footprints and roads shown in light grey.
The focus is on green, not gray.
Step 5: Existing Green Spaces
Parks, greenways, and urban forests added with green flocking and tree symbols.
Step 6: Proposed Green Spaces
New parks and greenways shown in a lighter green or with dashed outlines.
Step 7: Blue Infrastructure
Wetlands, ponds, and streams cast in blue resin.
Rain gardens and bioswales indicated with blue‑green textured strips.
Step 8: Access and Equity Analysis
Walking distance buffers (5‑minute, 10‑minute) added as transparent overlays.
Areas lacking access highlighted.
Step 9: Heat and Climate Features
Heat vulnerability zones overlaid with warm‑toned transparent film.
Cooling green spaces highlighted.
Step 10: Quality Control and Cover
The model is inspected for visual balance (green vs. gray).
A clear acrylic cover is fitted to protect flocking.
A custom Urban Green Space Planning Scale Model typically takes 8 to 12 weeks.
Applications for Green Space Models
Where are these models used?
Parks and Recreation Master Planning
Coordinate new park locations with population growth.
Climate Adaptation and Heat Resilience
Identify cooling corridors and prioritize tree planting in heat islands.
Stormwater Management Integration
Align green infrastructure with drainage needs.
Public Health and Equity Assessments
Ensure parks are within walking distance of all neighborhoods.
Community Engagement and Visioning
Residents point at areas lacking trees.
They propose new park locations with stickers.
Integration with Other Planning Model Types
A Satellite Town Planning Sand Table Model might include green belts and community gardens – your model ensures city‑wide connectivity.
Case Study: Green Space Model Reduces Heat Mortality Risk by 30%
A large Southern European city faced increasing summer heat waves.
Heat‑related mortality was rising.
The city’s climate adaptation office commissioned an Urban Green Space Planning Scale Model at 1:5,000 scale, covering a 3m x 2.5m table.
The model showed existing parks (dark green), heat vulnerability zones (orange overlay), and proposed new green corridors (light green ribbons).
Using the model, planners identified a dense neighborhood with no park access within 10 minutes.
A new pocket park was approved.
Tree planting along two major streets was accelerated.
Three years later, heat‑related mortality in that district dropped by 30%.
The model cost $35,000.
Lives saved: priceless.
Cost Factors for Green Space Models
Area covered – 20 sq km vs. 200 sq km.
Green feature density – Parks only vs. parks + greenways + green roofs + blue infrastructure.
Access analysis – Basic vs. 5‑minute and 10‑minute walking buffers.
Climate overlays – Static vs. removable heat vulnerability films.
Interactivity – Static vs. resident sticker workshops.
Typical range: 65,000 for a city‑wide model with full access analysis and climate overlays.
How to Choose a Model Maker for Green Space Projects
Experience with landscape or environmental models – Not just gray infrastructure.
Ability to represent tree canopy and greenways – Flocking and green ribbons.
Understanding of equity metrics – Walking distance buffers.
References from parks departments or climate agencies – Call two.
Ask for a sample of how they represent a greenway connecting two parks.
Maintaining and Updating Your Green Space Model
Green space networks grow as new parks are built.
Use removable green flocking patches – Add a park when it opens.
Replaceable tree symbols – Update tree canopy coverage.
Annual review – Compare to new park openings and tree planting data.
Budget for updates – Every 2–3 years for major green infrastructure projects.
For a Transportation Hub Planning Scale Model that includes green roofs and surrounding parks, the same modular approach applies.
Display Tips for Maximum Impact
In a Parks Department Office
Low table with natural‑spectrum lighting.
A legend showing green space types and access buffers.
For Public Workshops
Place the model on a rolling cart.
Provide green stickers for residents to propose new park locations.
In a Climate Resilience Center
Use heat vulnerability overlays during presentations.
Switch to green infrastructure overlays for stormwater discussions.
Keep the Acrylic Cover On When Not in Use
Flocking attracts dust – protect it.
Common Mistakes to Avoid
Do not make gray infrastructure (buildings, roads) too prominent.
Green spaces should dominate visually.
Do not forget connectivity.
Isolated parks are less valuable than a connected green network.
Do not ignore equity.
Show walking distance buffers to reveal underserved neighborhoods.
Do not use the same green for everything.
Distinguish regional parks from pocket parks.
Do not skip a legend.
Without a legend, viewers cannot interpret green space types or access buffers.
Integrating with Other Planning Model Types
A green space model complements specialized models for different urban systems.
For the economic core, a City Central Business District Sand Model might add green roofs and pocket parks – your model provides the city‑wide green network.
For a new town, a Satellite Town Planning Sand Table Model includes green belts and community gardens – your model ensures connectivity to the core city’s parks.
For transit nodes, a Transportation Hub Planning Scale Model can include green roofs and plaza trees – your model adds the surrounding greenways.
For underground infrastructure, a Municipal Engineering Planning Sand Table Model coordinates stormwater – your green space model shows the bioswales and rain gardens that manage that water.
For the big picture, a Regional Urban Planning Scale Model includes green corridors across multiple municipalities – your model provides the local park detail.
Each type serves a different purpose. The green space model is the foundation for healthy, climate‑resilient cities.
Future Trends in Urban Green Space Sand Table Models
Live tree canopy data – LEDs change color based on tree health from satellite imagery.
Augmented reality – Scan a park to see projected shade coverage over decades.
Community sticker workshops – Residents place green dots on the model to vote for park locations.
Sustainable materials – Biodegradable flocking and recycled acrylic for eco‑friendly displays.
Yet the core remains.
Residents need to see nature in their neighborhood to value it.
A physical model does that best.
Conclusion
An Urban Green Space Planning Scale Model is a powerful tool for designing healthy, equitable, and climate‑resilient cities.
It reveals gaps in park access, prioritizes cooling interventions, and engages communities.
Focus on green corridors, walking distance buffers, and climate overlays.
Keep gray infrastructure minimal.
Use the model in every public workshop.
Whether you are a parks director, climate planner, or public health official, invest in a green space model.
Your residents will be healthier.
Your city will be cooler.
And remember – whether you need a Satellite Town Planning Sand Table Model for a green belt, a Transportation Hub Planning Scale Model for a green roof at a station, a City Central Business District Sand Model for pocket parks downtown, a Municipal Engineering Planning Sand Table Model for stormwater bioswales, or a Regional Urban Planning Scale Model for cross‑municipality greenways, each can incorporate green space. But for the city‑wide, integrated network of nature, the dedicated urban green space planning scale model is essential.
Model your green city. Grow livable communities.


