Urban Cluster Planning Sand Table Model
Introduction
Not all cities stand alone.
Many grow in clusters – multiple towns, cities, and economic zones linked together.
Think of the Rhine‑Ruhr region, the Pearl River Delta, or Greater Tokyo.
These urban clusters are the engines of national economies.
But how do you plan a polycentric region?
Individual city models miss the connections.
You need a larger view.
That view is an Urban Cluster Planning Sand Table Model.
This guide explains why cluster models matter.
What features to include.
And how to use them for coordinated regional growth.
Let us begin.
What Is an Urban Cluster Planning Sand Table Model?
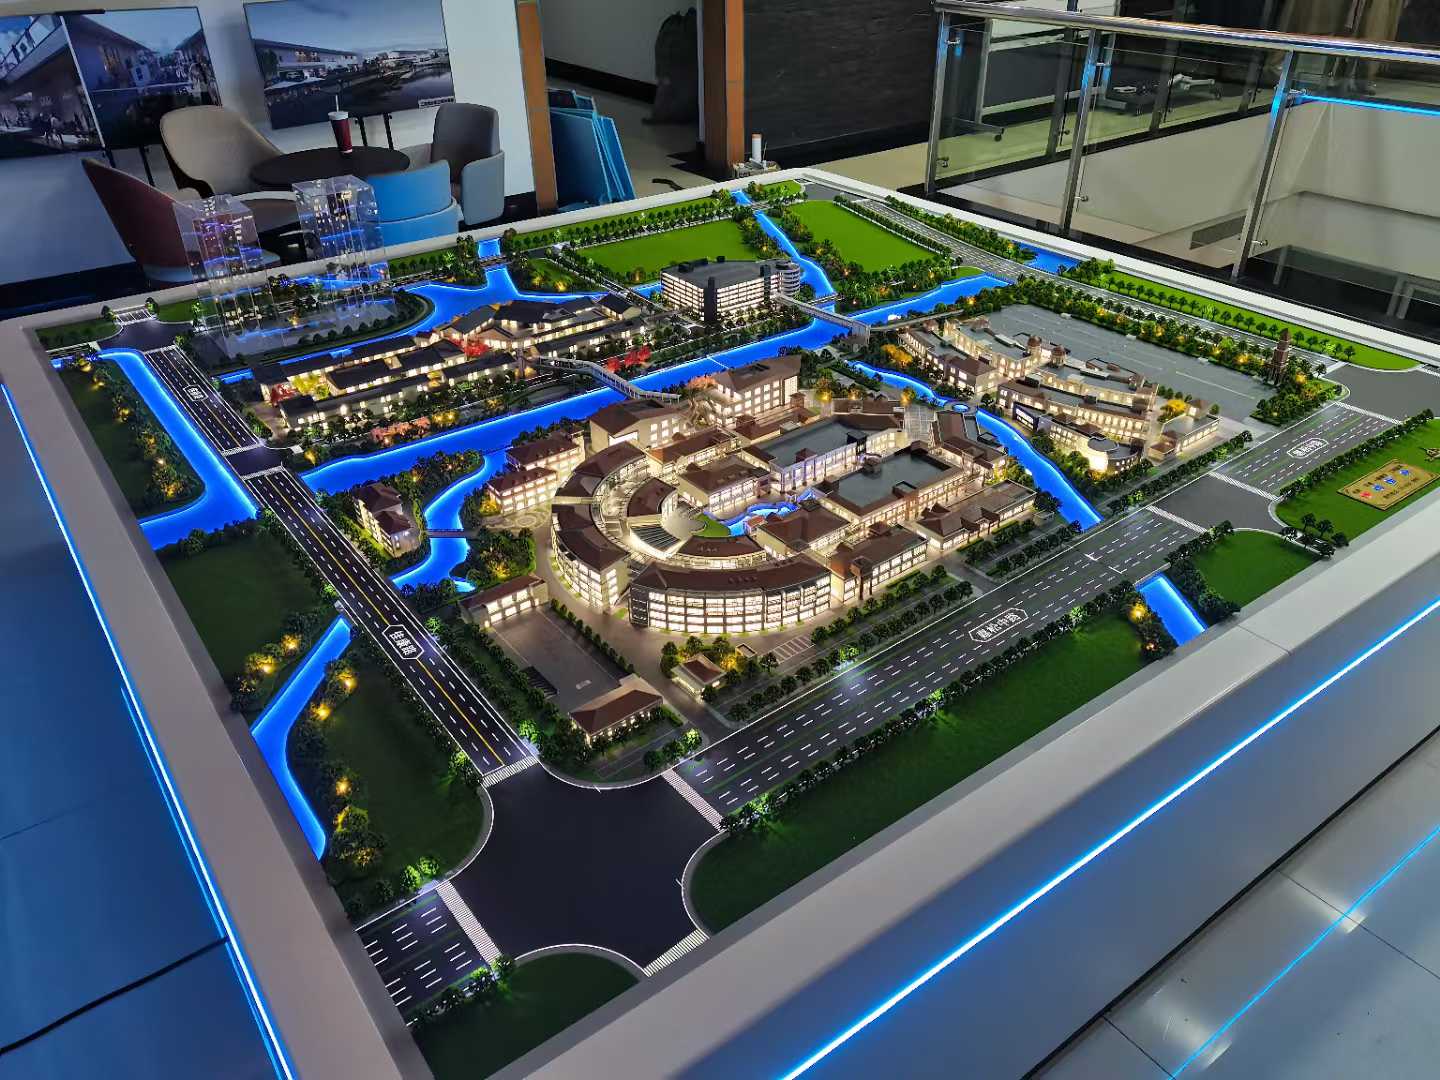
It is a physical miniature of a polycentric region.
Built on a large, sand‑textured base.
An Urban Cluster Planning Sand Table Model shows multiple urban centers, their growth boundaries, transportation corridors, economic zones, green buffers, and shared infrastructure.
Unlike a single‑city model, this one emphasizes relationships.
How does City A connect to City B?
Where are the commuter flows?
Which green spaces separate the clusters?
The model is used by regional planning agencies, economic development authorities, and infrastructure ministries.
Why Polycentric Regions Need a Dedicated Model
Single‑city planning creates silos.
Each municipality plans its own roads, utilities, and housing.
An Urban Cluster Planning Sand Table Model breaks those silos.
Planners see that a highway between City A and City B is at capacity.
They coordinate a new transit line that serves both.
Also, the model protects green buffers.
Urban sprawl is prevented when cluster boundaries are visible.
For investment promotion, a cluster model shows the scale of opportunity.
Key Features of an Urban Cluster Planning Sand Table Model
Let us break down what makes a model effective for polycentric planning.
Urban Centers and Hierarchies
Primary core city (largest), secondary cities, towns, villages.
Different sizes or colors.
Growth Boundaries and Urban Containment
Urban service boundaries, greenbelts, rural‑urban fringes.
Shown as dashed red lines.
Transportation Corridors
Highways, commuter rail, high‑speed rail, bus rapid transit, freight rail.
Thick, distinct lines linking clusters.
Economic and Industrial Zones
Business parks, logistics hubs, innovation districts, ports, airports.
Color‑coded with a legend.
Green and Agricultural Buffers
Protected open space, farmland, forests, watersheds.
Green textures – prevents sprawl.
Shared Infrastructure
Regional water treatment, power plants, waste management, data centers.
Symbols at cluster interfaces.
Commuter and Migration Flows
Arrows or dashed lines showing daily travel between clusters.
Helps plan transit capacity.
Phasing and Growth Corridors
Future expansion areas along transport axes.
Phase 1, 2, 3 distinguished.
Governance and Administrative Boundaries
Municipal borders shown as thin dotted lines.
Highlights where coordination is needed.
Interactive Features
Removable overlays for different growth scenarios.
LEDs to highlight transport corridors.
A well‑designed Urban Cluster Planning Sand Table Model answers: “How do these cities function as one integrated economy?”
Materials for Urban Cluster Models
Cluster models emphasize legibility over architectural detail.
Laser‑cut MDF or acrylic – For urban massing blocks.
Colored acrylic sheets – For urban centers and zones.
Fine sand or textured paint – For ground.
Printed vinyl – For transport lines, boundaries, and labels.
Blue resin – For regional water bodies.
Thin colored rods – For transit corridors.
Transparent overlays – For commuter flows and growth scenarios.
LED strips – For highway or rail corridors (optional).
Avoid individual building details – focus on urban footprints and connections.
The Custom Production Process: Step by Step
How is an urban cluster planning sand table model made?
Here is the typical workflow.
Step 1: Regional Data Compilation
You provide municipal boundaries, land use maps, transportation models, economic data, and environmental constraints.
The model maker identifies the cluster hierarchy and linkages.
Step 2: Scale Selection
Common scales: 1:10,000 to 1:50,000.
1:10,000 for a detailed cluster (e.g., 20 km radius).
1:25,000 for a large metropolitan region.
Step 3: Base and Regional Topography
A large reinforced base (often aluminum honeycomb) is built.
Major rivers, mountains, and coastlines sculpted.
Step 4: Urban Centers
Each city shown as a cluster of massing blocks.
Primary core largest, secondary centers smaller.
Step 5: Growth Boundaries
Urban service boundaries and greenbelts drawn as dashed lines.
Step 6: Transportation Corridors
Highways, rail lines, and transit corridors added as thick colored lines.
Step 7: Economic and Industrial Zones
Specialized zones color‑coded and labeled.
Step 8: Green and Agricultural Buffers
Protected open space added in green tones.
Step 9: Shared Infrastructure
Regional power plants, water treatment, etc., marked.
Step 10: Governance Boundaries
Municipal borders as thin dotted lines.
Step 11: Commuter Flow Arrows
Dashed arrows between clusters (optional overlay).
Step 12: Interactivity
Removable growth scenario overlays.
LEDs for major transport corridors.
Step 13: Quality Control and Cover
The model is inspected for legibility.
A low acrylic railing or full cover is added.
A custom Urban Cluster Planning Sand Table Model typically takes 12 to 16 weeks.
Applications for Urban Cluster Models
Where are these models used?
Regional Growth Strategies
Coordinate housing, jobs, and transit across municipal boundaries.
Transportation and Transit Planning
Identify capacity needs on inter‑city corridors.
Economic Development and Investment Promotion
Show the scale of a polycentric region to global investors.
Environmental and Greenbelt Protection
Prevent sprawl by visualizing urban containment.
Governance and Inter‑Municipal Coordination
Help mayors and council members see shared interests.
Integration with Other Planning Models
A New Energy City Planning Scale Model might show renewable energy systems across the cluster – your model provides the spatial framework.
Case Study: Cluster Model Unlocks $3B Transit Investment
A polycentric region of 2 million people across 12 municipalities had chronic traffic congestion.
Each municipality planned its own roads.
The regional planning authority commissioned an Urban Cluster Planning Sand Table Model at 1:25,000 scale, covering a 4m x 3m table.
The model showed six urban centers, existing highways (orange), and a proposed regional rail line (blue LED strip).
Using the model, the municipalities agreed on a common transit alignment.
The national government approved $3 billion for the rail line.
The model cost $78,000.
The transit investment was 38,000 times that.
Cost Factors for Urban Cluster Models
Area covered – 1,000 sq km vs. 10,000 sq km.
Number of urban centers – 3 vs. 15.
Transportation detail – Highways only vs. full rail, BRT, and commuter flows.
Governance boundaries – Simple vs. detailed municipal borders.
Interactivity – Static vs. scenario overlays and LEDs.
Typical range: 150,000 for a large, highly detailed polycentric region model with full transport and growth scenarios.
How to Choose a Model Maker for Cluster Projects
Experience with regional or polycentric models – Not just single cities.
Ability to handle large table sizes – 3m x 4m requires reinforced base.
Understanding of growth boundaries and greenbelts – Critical for cluster planning.
References from regional planning agencies – Call two.
Ask for a sample of a model showing multiple urban centers connected by transit corridors.
Maintaining and Updating Your Cluster Model
Regional plans evolve over decades.
Use removable growth overlays – Update Phase 1, 2, 3 boundaries.
Replaceable transit line stickers – Change when new routes open.
Annual review – Compare to updated census and commuting data.
Budget for major updates – Every 5‑10 years for regional plan revisions.
For a Comprehensive Urban Planning Scale Model that is part of a cluster, the same modular approach works.
Display Tips for Maximum Impact
In a Regional Planning Office
Low pedestal with even lighting.
A legend showing urban hierarchy and transport corridors.
For Inter‑Municipal Summits
Place the model on a large rolling cart.
Use laser pointers to trace transit corridors.
For Public Regional Visioning
Provide stickers for residents to indicate where they commute.
Show how cluster planning can reduce traffic.
Common Mistakes to Avoid
Do not focus on individual building details.
At 1:25,000, buildings are blocks – show urban footprints.
Do not forget green buffers.
The spaces between clusters are as important as the clusters themselves.
Do not ignore governance boundaries.
Municipal borders are where coordination fails – make them visible.
Do not make transport lines too thin.
A 1mm line at 1:25,000 represents 25m – easily visible.
Do not skip a legend.
Without a legend, viewers cannot distinguish urban centers from economic zones.
Integrating with Other Planning Model Types
An urban cluster model works alongside specialized models for different layers.
For a city planning a renewable transition, a New Energy City Planning Scale Model might focus on one cluster – your model shows how that cluster shares power with neighbors.
For heritage, a Historical City Protection Planning Model could highlight a historic core within a cluster – your model provides the regional context.
For a fully integrated vision, a Comprehensive Urban Planning Scale Model includes all layers across the cluster – your model is the base.
For public display, a Government Exhibition Urban Planning Sand Model can show the regional cluster at a visitor center – educating citizens about polycentric growth.
For green spaces, an Urban Landscape Planning Sand Table Model adds regional parks and greenways – your model ensures green buffers between clusters.
Each type adds depth. The urban cluster model is the framework for coordinated regional growth.
Future Trends in Urban Cluster Sand Table Models
Live commuting data – LEDs show peak hour traffic flows between clusters.
Augmented reality – Scan a cluster to see population density or economic output.
Modular governance overlays – Show different coordination scenarios (unified vs. decentralized).
Climate vulnerability – Overlays showing flood risk or heat islands across the cluster.
Yet the core remains.
Regional planners need to see the whole polycentric system.
A physical model does that best.
Conclusion
An Urban Cluster Planning Sand Table Model is essential for coordinating growth across multiple municipalities.
It reveals connections, prevents sprawl, and unlocks infrastructure investment.
Focus on urban hierarchy, transport corridors, green buffers, and governance boundaries.
Add scenario overlays for different growth paths.
Use the model in every regional planning meeting.
Whether you are a regional planner, economic developer, or infrastructure minister, invest in a cluster model.
Your region will grow smarter.
Your cities will stay distinct yet connected.
And remember – whether you need a New Energy City Planning Scale Model for renewables, a Historical City Protection Planning Model for heritage, a Comprehensive Urban Planning Scale Model for integration, a Government Exhibition Urban Planning Sand Model for public display, or an Urban Landscape Planning Sand Table Model for green spaces, each can be part of a cluster. But for the polycentric vision itself, the dedicated urban cluster planning sand table model is irreplaceable.
Model your cluster. Connect your region.


