Regional Urban Planning Scale Model Exhibition
Introduction
Regions are bigger than cities.
Counties, transit corridors, economic zones, watersheds.
How do you present a vision that spans multiple municipalities?
Digital maps are too abstract.
You need a physical model.
Specifically, a Regional Urban Planning Scale Model designed for exhibition.
This guide explains why regional models belong in public pavilions.
What features make them exhibition‑ready.
And how to use them for stakeholder engagement and funding.
Let us begin.
What Is a Regional Urban Planning Scale Model?
It is a physical miniature of a multi‑city region.
Built on a large, durable base for public display.
A Regional Urban Planning Scale Model shows urban centers, transportation networks, economic zones, natural features, and growth corridors across a broad area.
Unlike a city model, this one zooms out.
Scale is typically 1:10,000 to 1:50,000.
The model fits on a 2m x 3m table but covers 100+ square kilometers.
The model is used in exhibition halls, government pavilions, and public consultations.
Why Exhibit a Regional Planning Model?
Regional plans affect hundreds of thousands of people.
Public understanding is critical.
A Regional Urban Planning Scale Model on display draws crowds.
Visitors see how their town connects to the regional transit line.
They understand where new economic zones are planned.
For government pavilions at trade expos, a model becomes a conversation starter.
For funding proposals, a physical model demonstrates regional cohesion.
Also, the model serves as a permanent reference in a visitor center.
Key Features of an Exhibition‑Ready Regional Model
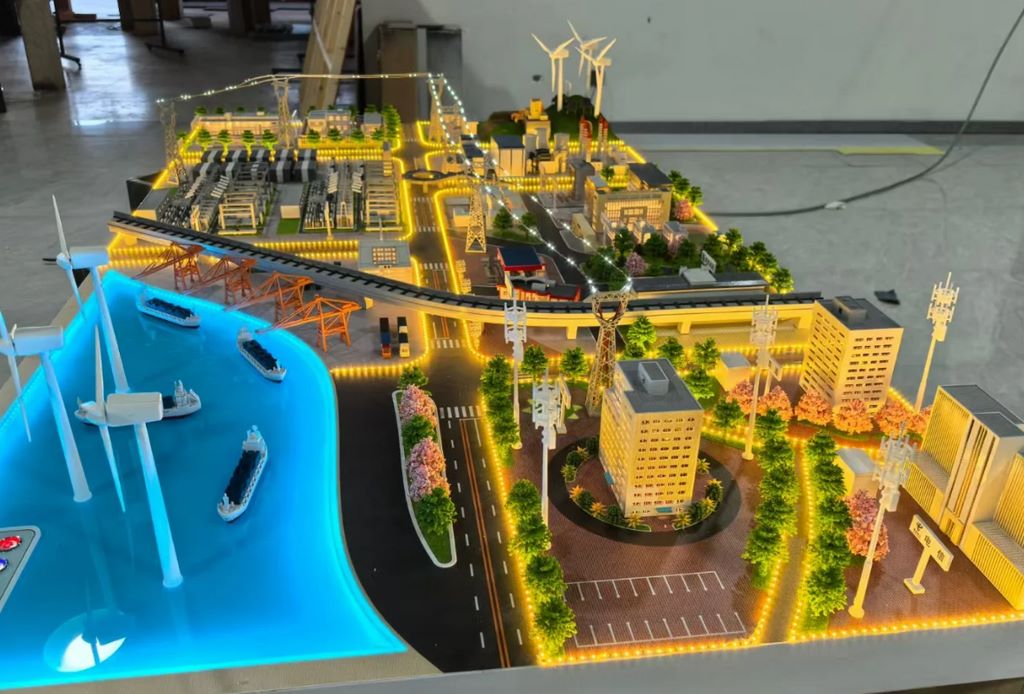
Let us break down what makes a model effective for public display.
Large Scale but Legible Area
Scale 1:10,000 to 1:50,000.
The entire region fits on a 2m x 3m table.
Major features (cities, highways, rivers) are readable from 1 meter away.
Clear Urban Hierarchy
Core city (largest), secondary cities, towns, villages.
Different sizes or colors.
Transportation Corridors
Highways, rail lines, transit corridors, airports, ports.
Thick, distinct lines.
Economic and Land Use Zones
Industrial parks, special economic zones, agricultural land, protected areas.
Color‑coded with a legend.
Natural Features
Rivers, lakes, mountains, forests, coastal zones.
Sculpted terrain and resin water.
Phasing and Future Growth
Planned transit extensions, new towns, future highways.
Shown as dashed lines or translucent blocks.
Interactive Elements for Exhibitions
Touch screen legend.
LEDs that highlight different regional layers (transport, economy, environment).
QR codes linking to digital plans.
A well‑designed Regional Urban Planning Scale Model balances detail with readability.
Materials for Exhibition‑Ready Regional Models
Regional models must withstand thousands of visitors.
Reinforced aluminum or MDF base – Warp‑resistant for large spans.
Laser‑cut acrylic or MDF – For city massing blocks.
Colored acrylic sheets – For zones and corridors.
Blue epoxy resin – For rivers and lakes.
Sculpted foam – For topography.
Printed vinyl – For labels and legends.
Low‑voltage LEDs – For interactive highlighting.
Durable clear acrylic railing – Protects the model while allowing viewing.
Avoid fragile details – regional models are viewed from a distance.
The Custom Production Process for Exhibition
How is a regional planning model made for public display?
Here is the typical workflow.
Step 1: Regional Data Compilation
You provide GIS data, census boundaries, transportation plans, and economic zone maps.
The model maker simplifies for the chosen scale.
Step 2: Scale and Table Sizing
Scale 1:10,000 to 1:50,000.
Table size typically 2m x 2.5m to 3m x 4m.
Step 3: Base and Topography
A reinforced aluminum honeycomb base is built.
Terrain sculpted from foam for hills, valleys, and watersheds.
Step 4: Water Features
Rivers, lakes, and coastal areas cast in blue resin.
Step 5: Urban Areas and Transportation
Core cities shown as clusters of blocks.
Highways, rail lines, and transit corridors applied as thick colored lines.
Step 6: Zones and Boundaries
Economic zones, agricultural areas, protected lands color‑coded.
Step 7: Phasing and Future Growth
Planned extensions added as dashed lines or translucent overlays.
Step 8: Interactive Elements
LEDs for layer highlighting.
Touch screen legend panel integrated into the display pedestal.
Step 9: Railing and Cover
A low acrylic railing (not a full cover) allows close viewing while protecting against touching.
A custom Regional Urban Planning Scale Model for exhibition typically takes 10 to 16 weeks.
Applications for Regional Exhibition Models
Where are these models displayed?
Government Pavilions at Expos
Attract visitors to your regional booth.
Explain complex plans in seconds.
Visitor and Interpretive Centers
A permanent installation that educates residents and tourists.
Public Hearings for Regional Plans
Citizens see how their community fits into the bigger picture.
Investment Roadshows
Show potential investors the region’s growth corridors.
University and Research Displays
Used for urban planning education.
Integration with Other Model Types
An Urban Renewal Planning Sand Table Model might focus on a specific district – your regional model provides the context.
Case Study: Regional Model Attracts $2B in Infrastructure Funding
A regional planning authority wanted funding for a 200‑km transit corridor connecting five cities.
Previous grant applications failed – reviewers could not visualize the regional benefit.
They commissioned a Regional Urban Planning Scale Model at 1:25,000 scale, covering a 3m x 2.5m table.
The model showed all five cities, the proposed transit line (glowing LED strip), economic zones (colored acrylic), and protected watersheds (blue resin).
At a federal infrastructure expo, the model was the centerpiece of their pavilion.
Reviewers walked around it for 15 minutes.
The grant was approved – $2 billion.
The model cost $65,000.
The return was over 30,000 times.
Cost Factors for Regional Exhibition Models
Area covered – 500 sq km vs. 5,000 sq km.
Scale – 1:10,000 (more detail) costs more than 1:50,000.
Topography complexity – Flat vs. mountainous (more sculpting).
Number of layers – 3 zones vs. 15 zones.
Interactivity – Static vs. LEDs and touch screen legend.
Typical range: 120,000 for a large, highly detailed model with full topography, LED corridors, and interactive touch screen.
How to Choose a Model Maker for Regional Exhibition Projects
Experience with large‑scale regional models – Not just city models.
Ability to handle GIS data – Converting census and boundary data into physical form.
Understanding of exhibition display standards – Railing, lighting, durability.
References from government or regional planning agencies – Call two.
Ask for a sample of a regional model showing multiple municipalities and a transit corridor.
Maintaining and Updating Your Regional Model
Regional plans evolve over decades.
Use removable corridor overlays – Update transit lines when alignment changes.
Replaceable zone stickers – Change economic zone boundaries.
Annual review – Compare to current regional plans.
Budget for periodic major updates – Every 5–10 years for regional plan revisions.
For a Transportation Hub Planning Scale Model that focuses on one node of the regional network, the same modular update approach applies.
Display Tips for Exhibition Pavilions
Raised Pedestal with Integrated Lighting
Model at waist height for children and wheelchair users.
Even, shadow‑free LED panels overhead.
Touch Screen Legend on a Swing Arm
Visitors can toggle different regional layers (transport, economy, environment).
Low Acrylic Railing, Not a Full Cover
People need to point.
A railing protects without blocking access.
Printed Takeaway Legends
Small brochures explaining the regional vision.
Visitors take them home.
Common Mistakes to Avoid
Do not make the model too detailed for the scale.
At 1:25,000, individual buildings are tiny dots – use massing clusters.
Do not forget a legend.
Without a legend, colors and symbols are meaningless.
Do not ignore topography.
Mountains and rivers define regional growth patterns.
Do not place the model in a dark corner.
Exhibition halls are bright – the model needs even lighting.
Do not use fragile materials.
Thousands of visitors will lean on the railing – the model must be robust.
Integrating with Other Planning Model Types
A regional model often works alongside specialized models for different scales.
For a specific urban core, a City Central Business District Sand Model zooms in on downtown – your regional model shows how that CBD connects to suburbs and other cities.
For a transit interchange, a Transportation Hub Planning Scale Model provides detailed station design – your regional model shows the corridor that feeds the hub.
For infrastructure below ground, a Municipal Engineering Planning Sand Table Model coordinates utilities – your regional model shows the broad growth corridors that drive utility demand.
For a revitalizing district, an Urban Renewal Planning Sand Table Model focuses on demolition and new construction – your regional model shows how that district fits into the regional economy.
For town‑level planning, a Town Planning Scale Model provides local zoning detail – your regional model shows how towns interconnect.
Each type serves a different scale. The regional model is the big‑picture anchor for any exhibition.
Future Trends in Regional Exhibition Sand Table Models
Live data feeds – LEDs show real‑time traffic congestion or economic activity across the region.
Augmented reality – Scan the model to see projected population growth or housing demand.
Modular expansion – Add new municipalities as the region grows.
Sustainable materials – Recycled acrylic for eco‑friendly regional brands.
Yet the core remains.
Citizens and investors need to see the whole region to believe in its future.
A physical model does that best.
Conclusion
A Regional Urban Planning Scale Model designed for exhibition is a powerful tool for communication, funding, and education.
It turns complex regional data into an inspiring, shareable display.
Focus on clear urban hierarchy, transportation corridors, and natural features.
Add interactive elements for engagement.
Protect the model with a low railing.
Whether you are a regional planning authority, economic development agency, or government pavilion organizer, invest in a regional model.
Your stakeholders will see the big picture.
Your region will grow smarter.
And remember – whether you need an Urban Renewal Planning Sand Table Model for a district, a Transportation Hub Planning Scale Model for a node, a City Central Business District Sand Modelfor the core, a Municipal Engineering Planning Sand Table Model for underground systems, or a Town Planning Scale Model for local zoning, each is part of the regional mosaic. But for the entire multi‑municipality vision, the dedicated regional urban planning scale model exhibition display is irreplaceable.
Model your region. Inspire collective action.


