City Central Business District Sand Model
Introduction
The central business district is a city’s engine.
Skyscrapers, corporate headquarters, retail, transit hubs.
How do you present a multi‑billion dollar CBD vision to investors and the public?
Digital renderings are impressive but fleeting.
You need a physical model.
Specifically, a City Central Business District Sand Model.
This guide explains why CBDs need dedicated models.
What features matter.
And how to use them for investment attraction and planning approvals.
Let us begin.
What Is a City Central Business District Sand Model?
It is a physical miniature of a downtown core.
Built on a sand‑textured base.
A City Central Business District Sand Model shows office towers, retail streets, public plazas, transit stations, and civic buildings.
Unlike a city‑wide model, this one focuses on density and verticality.
Building heights are precise.
Pedestrian connections are highlighted.
The model is used by economic development agencies, real estate developers, and city planning departments.
Why the CBD Deserves a Dedicated Sand Model
The CBD is the most valuable real estate in any city.
A misstep in design affects property values for decades.
A City Central Business District Sand Model helps stakeholders see the whole.
Investors understand where their tower sits relative to transit.
Planners test shadow impacts on public plazas.
Retailers choose locations based on pedestrian flow.
Also, the model is a powerful marketing tool.
A stunning CBD model attracts corporate relocations and hotel investments.
For public engagement, residents see where new parks and affordable housing fit among the towers.
Key Features of a CBD Sand Table Model
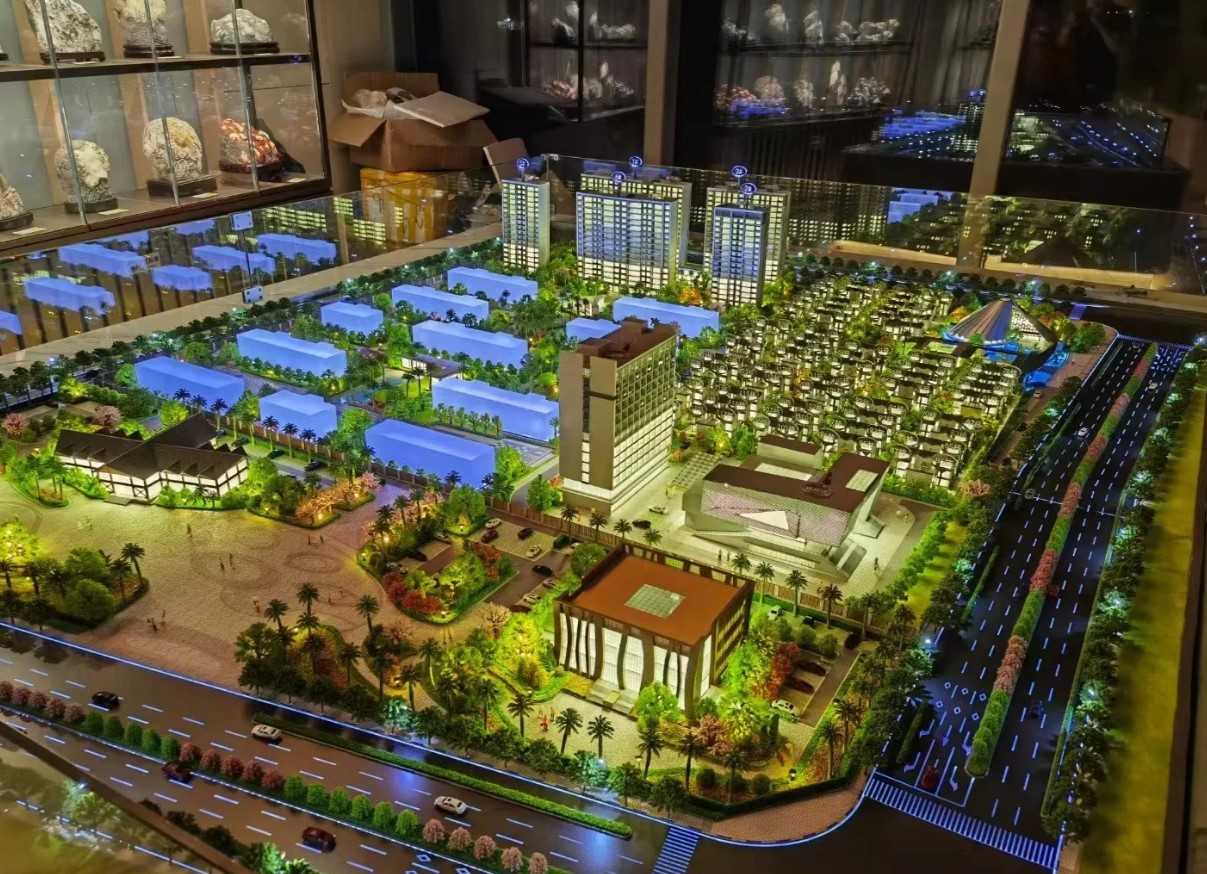
Let us break down what makes a model effective for central business district planning.
Building Height and Massing
Skyscrapers shown with accurate heights.
Use different colors or textures for office, residential, hotel, and retail.
Public Spaces and Plazas
Parks, squares, pedestrian promenades, pocket parks.
Critical for quality of life in high‑density areas.
Transit Integration
Subway entrances, bus stops, bike‑share stations, pedestrian bridges to transit hubs.
Connections to a Transportation Hub Planning Scale Model can be shown as overlays.
Street Hierarchy and Pedestrian Flow
Major boulevards, retail streets, pedestrian‑only zones.
Sidewalk widths and crosswalks matter.
Landmark and Signature Buildings
Iconic towers, historic landmarks, cultural institutions.
Given extra detail (e.g., 3D printed facades).
Phasing and Development Parcels
Available development sites marked.
Phase 1, 2, 3 construction zones distinguished.
Shadow and Sunlight Studies (Optional)
Removable overlays or small LEDs to simulate sun angles at different times of year.
Interactive Investment Features
QR codes on each tower linking to leasing information.
LEDs highlighting available office space.
A well‑designed City Central Business District Sand Model answers: “Is this a place where businesses and people want to be?”
Materials for CBD Sand Models
CBD models emphasize precision, beauty, and durability.
Laser‑cut acrylic and MDF – For building massing blocks.
Clear acrylic – For glass curtain walls on signature towers.
3D printed resin – For iconic building facades and landmarks.
Fine sand or textured paint – For ground and plazas.
Colored flocking – For parks and green spaces (sparingly).
Micro LEDs – For streetlights and building accents.
Printed vinyl – For street names and parcel labels.
Avoid clutter – the skyline should be readable from across the room.
The Custom Production Process: Step by Step
How is a CBD sand table model made?
Here is the typical workflow.
Step 1: CBD Master Plan Data
You provide zoning maps, building elevations, public space designs, and phasing schedules.
The model maker identifies key landmarks and development parcels.
Step 2: Scale Selection
Common scales: 1:500 to 1:2,000.
1:500 for a detailed block‑by‑block model.
1:1,000 for a larger district.
Step 3: Base and Terrain
A reinforced MDF or aluminum base is cut.
Major streets and plazas are marked.
Step 4: Building Massing
Each building is laser‑cut or 3D printed to accurate height.
Signature towers receive facade detailing.
Step 5: Public Spaces and Transit
Parks, plazas, transit entrances added.
Pedestrian paths highlighted.
Step 6: Phasing and Parcels
Available development sites marked with removable colored blocks.
Phase boundaries indicated.
Step 7: Lighting and Interactivity
Streetlights and building accent LEDs installed.
QR codes or magnetic parcel markers for investor roadshows.
Step 8: Quality Control and Cover
The model is inspected for skyline legibility.
A low acrylic railing (not a full cover) allows close viewing.
A custom City Central Business District Sand Model typically takes 8 to 14 weeks.
Applications for CBD Sand Models
Where are these models used?
Economic Development and Investment Promotion
Attract corporate headquarters, hotels, and retail anchors.
Investors see available sites and transit access.
City Planning and Zoning Reviews
Test shadow impacts, building setbacks, and density bonuses.
Public Engagement and Downtown Visioning
Residents see where new affordable housing, parks, and transit stations will go.
Marketing and Leasing for Commercial Real Estate
Brokers use the model to show available office floors.
Disaster and Emergency Planning
Identify evacuation routes and emergency vehicle access in the dense core.
Integration with Other Planning Model Types
An Urban Renewal Planning Sand Table Model might cover a CBD revitalization area – your model provides the broader downtown context.
Case Study: CBD Model Attracts $1B in Corporate Relocations
A mid‑sized U.S. city wanted to attract corporate headquarters to its under‑developed downtown.
After two years of slow progress, they commissioned a City Central Business District Sand Modelat 1:800 scale, covering a 2.5m x 2m table.
The model showed 15 development parcels color‑coded by status (green for available, blue for under negotiation, red for committed).
Signature towers had illuminated crowns.
Transit connections to a planned light rail were shown with glowing LED lines.
At an economic summit, the model was the centerpiece.
Three Fortune 500 companies committed to relocating within 18 months.
Total investment exceeded $1 billion.
The model cost $45,000.
The return was over 22,000 times.
Cost Factors for CBD Sand Models
Area covered – 20 blocks vs. 100 blocks.
Scale – 1:500 (more detail) costs more than 1:2,000.
Number of buildings – 50 vs. 500.
Signature tower detail – Simple blocks vs. 3D printed facades with LEDs.
Interactivity – Static vs. magnetic parcel markers and QR codes.
Typical range: 80,000 for a large, highly detailed CBD model with signature tower facades and interactive investment features.
How to Choose a Model Maker for CBD Projects
Experience with high‑density urban models – Not just suburban planning.
Ability to create accurate building heights – The skyline must be precise.
Understanding of shadow and sunlight studies – Optional but valuable.
References from economic development agencies – Call two.
Ask for a sample of a skyline model with varied building heights and a signature tower.
Maintaining and Updating Your CBD Model
CBDs evolve as new towers are built and parcels are sold.
Use magnetic building blocks – Replace a “planned” block with a “built” block.
Replaceable parcel status stickers – Update availability colors.
Annual review – Compare to current leasing and construction progress.
Budget for updates – Every 1–2 years for active development zones.
For a Smart City Urban Planning Architectural Model that overlays real‑time data on the same CBD, the modular approach allows easy integration.
Display Tips for Maximum Impact
In a Downtown Investment Center
Low pedestal with dramatic spotlights.
Touch screen legend with parcel details and broker contacts.
For Public Workshops
Place the model in a community center.
Use laser pointers (non‑laser for safety).
Provide colored stickers for residents to indicate desired amenities.
At Investor Roadshows
Portable version on a wheeled cart.
Battery‑powered LEDs for key development sites.
Common Mistakes to Avoid
Do not make all buildings the same height.
The skyline must show the real hierarchy.
Do not forget public spaces.
Plazas and parks are what make a CBD livable.
Do not ignore transit connections.
Subway entrances and bus stops are deal‑makers for tenants.
Do not use the same color for different land uses.
Office, residential, hotel, and retail must be distinguishable.
Do not skip a legend.
Without a legend, viewers cannot interpret parcel status or building colors.
Integrating with Other Planning Model Types
A CBD model often works alongside specialized models for different urban systems.
A Transportation Hub Planning Scale Model for the main train station or subway interchange complements the CBD model – showing how commuters flow into the core.
A Smart City Urban Planning Architectural Model can overlay real‑time pedestrian counts, air quality, and energy usage on the same CBD base – your model becomes a live data display.
An Ecological City Planning Sand Table Model adds green roofs, rain gardens, and tree canopy to the CBD – making the downtown sustainable.
A Town Planning Scale Model for the wider municipality shows how the CBD connects to residential neighborhoods and industrial zones.
For a CBD undergoing revitalization, an Urban Renewal Planning Sand Table Model would focus on demolition and new construction phasing – your model is the end vision.
Each type serves a different purpose. The CBD model is the economic heart.
Future Trends in CBD Sand Table Models
Live real estate data – LEDs change color when a floor is leased.
Augmented reality – Scan a tower to see tenant names and available square footage.
Modular building blocks – Swap out older buildings for proposed towers.
Shadow simulation projectors – Show sunlight patterns at different times of day.
Yet the core remains.
Investors and planners need to see the whole downtown to commit capital.
A physical model does that best.
Conclusion
A City Central Business District Sand Model is the ultimate tool for attracting investment and shaping the urban core.
It turns a vision of density and vitality into a tangible reality.
Focus on building heights, public spaces, and transit connections.
Add interactive parcel markers for investor roadshows.
Plan for updates as new towers rise.
Whether you are an economic development director, a commercial real estate broker, or a city planner, invest in a CBD model.
Your investors will see the returns.
Your downtown will thrive.
And remember – whether you need an Urban Renewal Planning Sand Table Model for a revitalization area, a Transportation Hub Planning Scale Model for transit connectivity, a Smart City Urban Planning Architectural Model for data integration, an Ecological City Planning Sand Table Model for green infrastructure, or a Town Planning Scale Model for municipal context, each can complement a CBD model. But for the economic core itself, the dedicated city central business district sand model is irreplaceable.
Model your downtown. Build your future.


